Debugging R and C code in R
It is very rare for interesting code to contain no bugs at first writing. Hopefully the existence of these bugs will be detected by the code's tests, but why the bug occurs will still require work to establish: debugging.
All debugging involves a cycle of gathering data on the problem, formulating hypotheses about what might be causing the problem and then gathering further data to confirm or refute the hypotheses. Most people's first instinct is to do this by inserting print statements into the code to output the required data. This is only rarely the optimally time-efficient approach, and it is often better to use debugging tools.
These notes cover some tools for debugging R code, and C/C++ code called from R, in particular Mark Bravington's 'debug' package, the 'valgrind' memory error checker and 'gdb' used alone or via 'emacs' or 'DDD'. See also
Writing R extensions
(section 4).
The notes assume you are running Linux or similar. I used Ubuntu 16.04 (Sept 2019), and modified slightly after some problems with emacs debugging on Ubuntu 20.04.
Debugging R code
R provides functions 'debug', 'debugcall', 'trace' and 'traceback' for debugging R functions. See their help files for further information. Rstudio also offers debugging facilities. Personally I prefer Mark Bravington's 'debug' package.
-
Within R
options( repos= c( "https://markbravington.github.io/Rmvb-repo", getOption( "repos")))
and then
install.packages("debug")
.
-
require(debug)
within R.
-
'mtrace' sets a routine up for debugging. e.g.
mtrace(lm)
-
To debug the routine, just call it, e.g.
lm(rnorm(10)~runif(10))
-
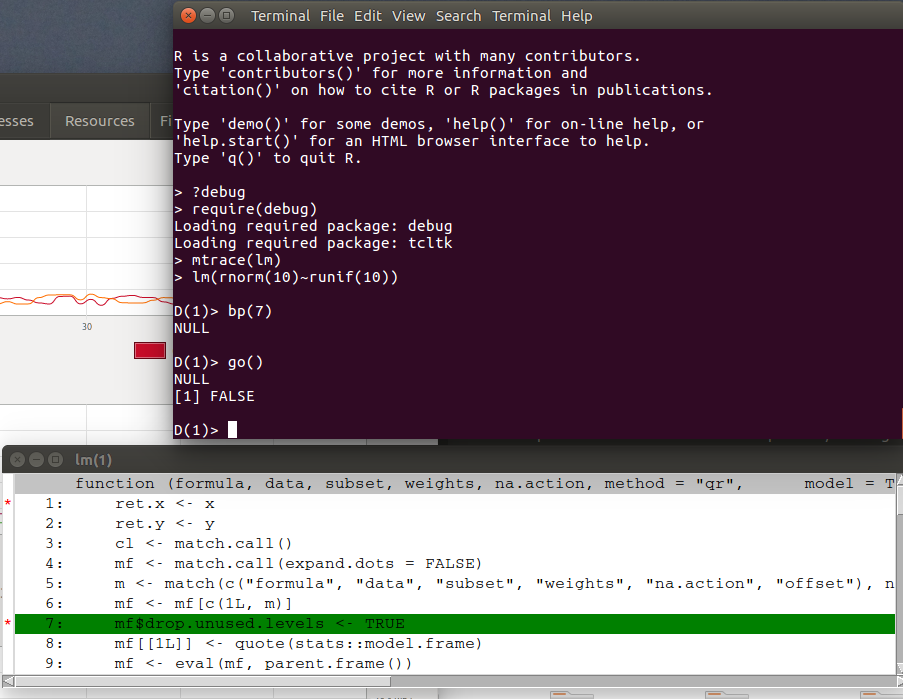
This produces a separate source code window highlighting the next line of code to execute in green, while in the R window the prompt changes to
D(1)>
.
-
At the prompt you can enter R commands in the usual way --- which allows variables to be examined.
-
Simply pressing return executes the current line of code.
-
Breakpoints are set using the 'bp' function. For example:
1.
bp(101)
sets a breakpoint at line 101 of the current function, while
bp(101,FALSE)
turns it off again. The location of breakpoints show up in the source code window.
2.
bp(12,i>6,foo)
sets a breakpoint at line 12 of function foo. Execution will halt there if the condition 'i>6' is met.
See
?bp
for more.
-
go()
runs to completion, an error, or the next breakpoint.
-
To step into a function, either
mtrace
it or set a breakpoint in it.
-
qqq()
quits the debugger.
-
Here is a screenshot of the debugger stopped at a breakpoint set at line 8 of
lm
.
There are a few minor issues which you may encounter.
-
If 'bar' is a function that is an element of a list 'foo' then
mtrace(foo$bar)
will fail. An easy fix is to make a copy of 'bar', e.g.
foobar <- foo$bar
then
mtrace(foobar)
and simply call 'foobar' from the
D(1)>
prompt using the arguments that would have been supplied to
foo$bar
.
-
Occasionally executing the current line by pressing return will fail even though there is nothing actually wrong with the line (usually because it does something odd with environments). You can get around this by setting a breakpoint after the line and
go()
ing to it.
-
Using the up arrow key to obtain an earlier command at the
D(1)>
prompt can lead to some weird behaviour if you try to edit the command while the
D(1)>
prompt is present. But if you use the down key after the up key the prompt disappears, and editing works just fine!
-
Interrupting code execution with
<ctrl> c
causes the source window to stop working properly. The following commands avoid having to restart R to fix this
detach("package:debug",unload=TRUE)
detach("package:tcltk",unload=TRUE)
library(debug)
Debugging C/C++ called from R (on linux)
When writing C code to be called from R it is very rare to get it completely right first time (at least if the code is doing something interesting). Typically even if the code runs first time it will fail some of the tests you use to check it, and you will then need to figure out why. As already mentioned, all debugging involves a cycle of gathering data on the problem, formulating hypotheses about what the problem's cause might be, and then gathering further data to confirm or refute the hypotheses. The temptation is often to gather all data by insertion of
Rprintf
calls into the code. This often works in simple cases, but can be hugely inefficient for more complicated bugs (to the point of insanity in the case of segmentation faults).
The following sections provide information on how to get started with debugging tools for C code called from R. 'valgrind' is used for pinpointing memory errors, while 'gdb' is used for examining running code to help figure out where it is going wrong. 'gdb' can be used from within 'emacs' or in text based mode. The former is generally more useful (unless you are the sort of person who preferes 'vi' to 'emacs'), but takes a little more setting up. Another nice graphical interface for 'gdb' is 'DDD' - this is slightly less effort to set up than gdb via emacs, but does not offer source editing.
There are other debuggers that can be used to debug C called from R. My favourite from an ease of use perpective was 'nemiver', but unfortunately it seems to be no longer maintained and is effectively broken on my system.
Finding memory errors with valgrind
If you write C code, you should use valgrind. C's enormous flexibility allows you to accidentally produce serious memory corruption. valgrind is usually the fastest way to find such problems (by several orders of magnitude). It works by emulating your CPU with a bunch of added instrumentation that enables it to spot memory errors (such as reading and writing to un-allocated memory). If your code is segfaulting then try running it again using valgrind. To do this start R using
R -d "valgrind"
(you can pass options to valgrind within the quotes). Then run your code from R and wait for it to report errors. Here is an example error report (the first error for this proramme, which is obviously the one to fix first.)
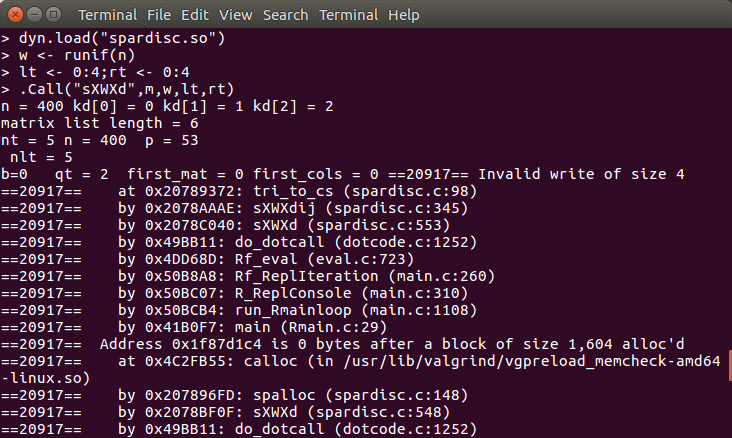
You can see that I loaded a shared object file 'spardisc.so'into R and then issued the command
.Call("sXWXd",m,w,lt,rt)
to call one of its routines. This routine spat out some output before valgrind detected an error produced by function 'tri_to_cs' at line 98 of 'spardisc.c', which had been in turn called from line 345 in function 'sWXWdij' etc. It seems an integer value has been written where it should not have been.
It is usually good practice to use R's memory allocation and freeing functions (such as 'R_chk_calloc') for memory allocation in code to be called from R (running out of memory is then handled gracefully, for example). However this can sometimes make memory errors harder to find. A good option is to
#define CALLOC
as
R_chk_calloc
or
calloc
and allocate memory only with
CALLOC
, so that you can readily switch the memory allocation routines for debugging (same for
FREE
of course).
It is good practice to check newly written C code with valgrind even if it appears to be running without problem.
Using gdb with emacs for C called from R
The advantage to this approach is the graphical setting of breakpoints combined with the ability to move around your code as you debug it in a convenient way. Once you know how to do this it is very quick to set up, but the first time through it is easy to go wrong, so I have provided very detailed instructons below. The instructions assume that you are producing a shared library and loading it explicitly using 'dyn.load' in R. If you are debugging a package things are basically the same, but you need to install the package from its source tree (i.e. not from a .tar.gz), start emacs from within the 'src' directory and set the symbolic link to R from there too.
-
Compile your code using
R CMD SHLIB foo.c
to produce 'foo.so'. To turn on debugging information and turn off optimization, you probably first want to create 'Makevars' in the '.R' directory of your home directory, containing the line
CFLAGS=-g -O0 -Wall -pedantic
(the last two options are turning on maximum compiler wingeyness). You can just comment out this line with
#
to turn the options off again.
-
Now find two paths
-
to the actual binary executable for R (not the shell script usually used to start it). On linux you can do this by starting R and typing
commandArgs()[[1]]
. For me this gave "/usr/local/lib/R/bin/exec/R".
-
the 'R_HOME' path: In R type
R.home()
. For me this gave "/usr/local/lib/R". Check that 'libRblas.so' is in the 'lib' subdirectory of this path, and locate it if it isn't.
-
Create a symbolic link to the R executable in the directory containing your source files: e.g.
ln -s /usr/local/lib/R/bin/exec/R
. You can use
rm
to remove this later. This step just makes things a bit more convenient.
-
In the terminal where you will start emacs issue the commands:
-
export LD_LIBRARY_PATH="/usr/local/lib/R/lib:$LD_LIBRARY_PATH"
where the path given is the one to 'libRblas.so' - this is not always needed, but on some setups R will fail to start within emacs without it.
-
export R_HOME="/usr/local/lib/R"
where the path is the one found above. Alternatively you can wait and issue the command
set env R_HOME /usr/local/lib/R
at the
(gdb)
prompt.
-
Start emacs (gui version) from your source directory, loading your source code. e.g.
emacs foo.c&
.
-
Within emacs issue the command
<esc>-x gdb
(
<esc>
is the emacs meta key referred to as
M
in the emacs documentation).
-
Issue the command
gdb -i=mi R
within emacs (it will likely suggest something slightly different related to your source file - just edit its suggestion).
i=mi
is just setting
gdb
up to communicate in the way emacs expects.
-
Now set a breakpoint at the first point where you would like to stop in your code. For example at the
(gdb)
prompt I might type
break sXWXd
to break on entry to the routine 'sXWXd', or
break foo.c:1066
to break at line 1066 of 'foo.c'. The breakpoint may be pending at this point. That's fine.
-
Clicking on 'Run' will now start R, and emacs will display a 'gdb' window (called 'gud-R') and an R i/o window within the emacs 'frame' (emacs refers to sub-windows/panels as windows, and calls the whole window a frame).
-
You might well want three windows: '(gdb)', R I/O and source:
-
I would usually click on the 'gud-R' window and select my source file from the 'buffer' menu.
-
Then click on the R I/O window and select 'New window on right' from the 'File' menu.
-
After clicking on the new window I would select 'gud-R' from the 'Buffers' menu.
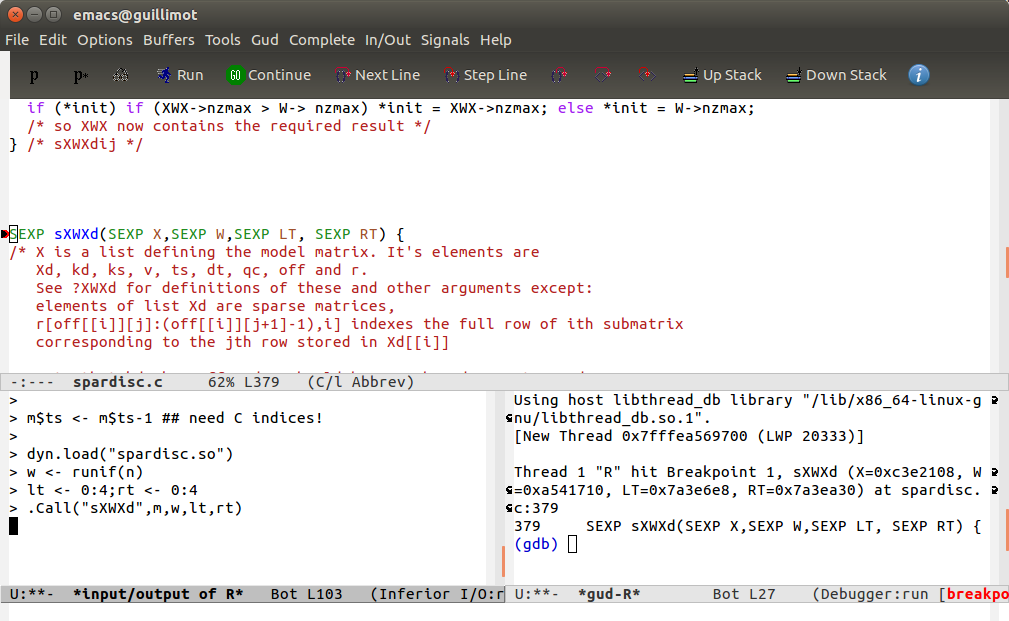
Now I have my source file, R console and gdb console all visible.
-
Finally enter the code into the R console required to load and run your code from within R. i.e the code that includes something like
dyn.load("foo.so")
and the C calling code --- in my case
.Call("sXWXd",m,w,lt,rt)
-
Now setup is complete, and you should have a window looking something like:
Here are a few tips for using the debugger.
-
You can set and clear breakpoints by clicking in the margin of the source window and step through or run to breakpoints using the buttons at the top of the frame.
-
Conditional break points can be set at the '(gdb)' prompt. For example
break foo.c:398 if i>11
sets a breakpoint at line 398 of 'foo.c' and tells the debugger to stop there only once 'i' exceeds 11. (emacs displays line numbers, or you can set and clear a breakpoint manually to find them.)
-
You can examine variable values using
p
at the '(gdb)' prompt. For example:
-
p x
prints the value of 'x'.
-
p *x
prints the value pointed to by 'x'.
-
p *(x+2)@3
prints the 3 values in array 'x' starting at 'x[2]'.
An alternative is to highlight the variable name of interest and select 'Watch Expression' from the 'Gud' menu.
-
Several other display windows are offered from the 'Gud' menu. On my system (Ubuntu 16.04) items from the 'GDB-Frames' and 'GDB-Windows' sub-menus are buggy and can cause the 'gud-R' window to become unusable.
-
You can reset the values of variables at the '(gdb)' prompt. e.g.
-
set foo = 1
resets variable 'foo' to 1.
-
set *(foo + 3) = 1.3
sets
foo[3]
to 1.3.
-
set *(foo + 3)@3 = { 5, 4, 1 }
sets
foo[3:5]
to the given values.
-
kill
at the '(gdb)' prompt will kill R. The 'Run' button can then be used to restart it.
Using gdb without emacs for C called from R
The instructions for this are much shorter, but the debugging facilities are entirely text based.
-
Prepare your shared object file or package as described in the previous section (on gdb in emacs).
-
Start the debugger using
R -d gdb
and then type
R
to start R.
-
Load your shared object file with something like
dyn.load("foo.so")
or load you package.
-
Type
<ctrl> c
when you are ready to set breakpoints.
-
Set break points using something like
break function_name
or
break foo.c:123
(to stop at line 123 of 'foo.c').
-
Type
signal 0
to continue in R.
-
When halted at a breakpoint, or elsewhere in the code, further breakpoints can be added with the commands already seen, or simply
break 432
to break at line 432 of the current file.
clear 432
clears the preceding breakpoint.
-
n
to execute next line.
p
for printing as in previous section.
-
See 'gdb' documentation for more on what it can do.
Using DDD to debug C code called from R
DDD
is a graphical front end for gdb (and other debuggers). Use is pretty straightforward.
-
Prepare your shared object file or package as described in previous sections.
-
Start R from the directory containing the source to debug with the command
R -d "ddd"
.
-
Typically you will then press the 'Run' button on the 'DDD' panel.
-
Select 'Execution Window' from the 'View' menu to get the running R window.
-
Do whatever is needed to load your code using the execution window and then click on the 'Interrupt' button from the 'DDD' panel.
-
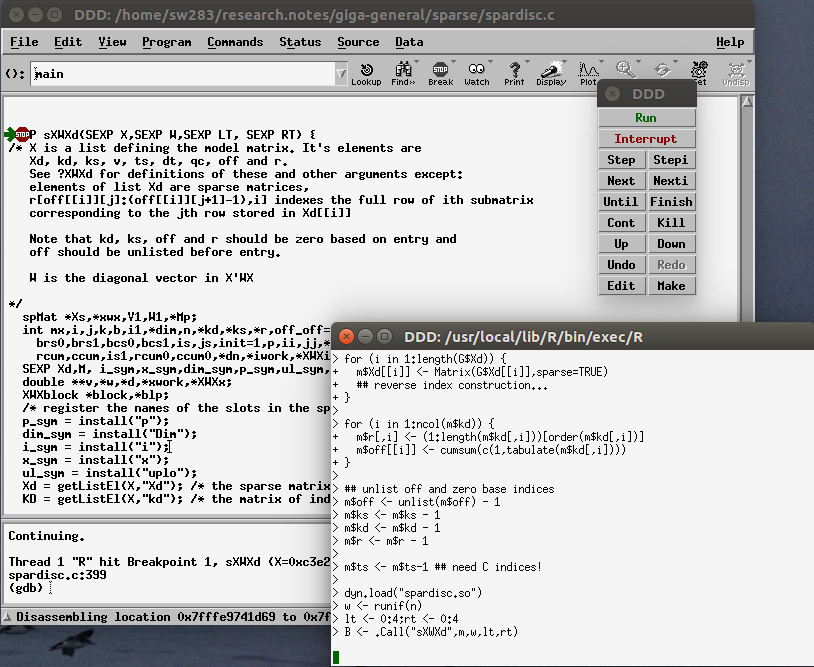
Set an initial breakpoint in your code at the '(gdb)' prompt, exactly as in the previous sections. Then click on 'Cont' from the 'DDD' panel (clicking 'Run' again would lead to R restarting from scratch - not what you want).
-
In the R window do whatever is needed to call your code. The debugger will stop at the set breakpoint. You can then set further breakpoints from the '(gdb)' prompt or graphically (see previous sections). The debugger will look something like this:
A few use hints:
-
Occasionally DDD hangs at startup giving a message about waiting for gdb to start: deleting the hidden '.ddd' folder in your home directory will sort this out.
-
Hovering over a variable in the source window reveals its current value.
-
Highlighting a variable allows you to set its value by clicking on the 'set' button.
-
Clicking on the whitespace in a line causes the line number to be displayed in the box near the display top (containing 'main' in the above).
-
'(gdb)' commands for printing and setting variables are those given in previous sections.
-
Stepping through the program uses the 'next' and 'step' buttons from the 'DDD' panel.